sTAM Tutorial
January 09, 2020
How to perform miRNA set enrichment analysis?
How to perform pre-ranked miRNA set enrichment analysis?
Single sample miRNA set enrichment analysis
Please jump to "ssMSEA" tab page.
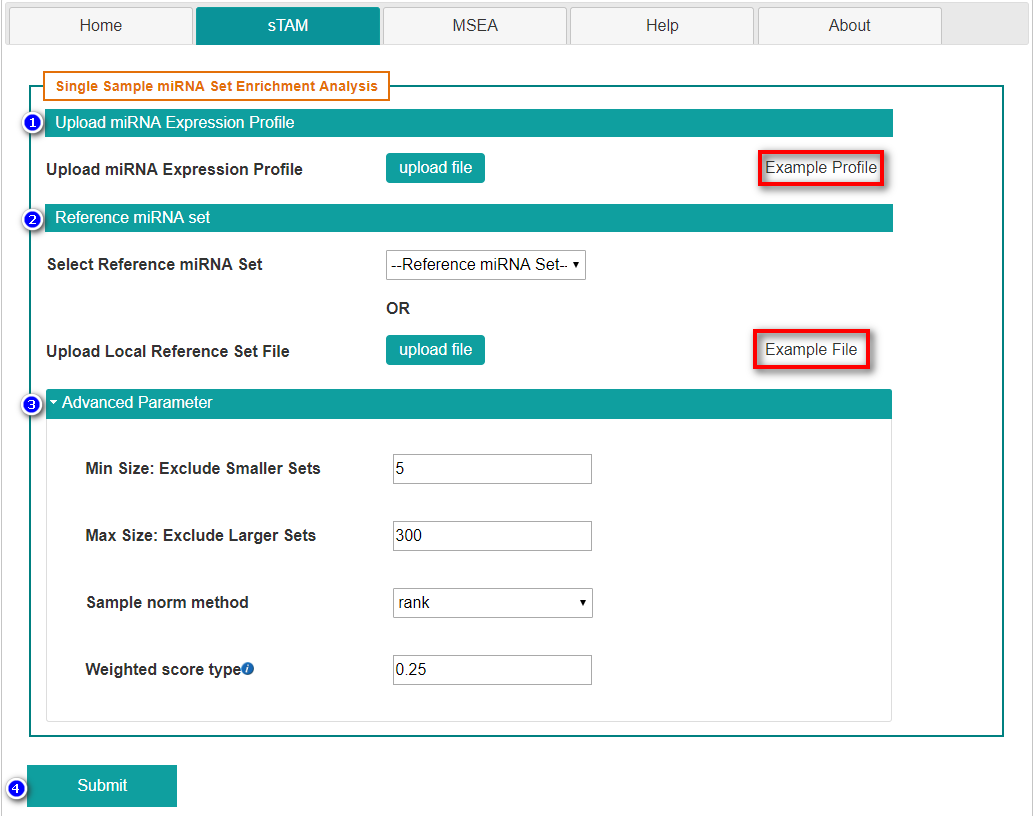
- Upload miRNA expression profile.
- Select reference miRNA set
- Set advanced parameters
- Min Size: Minimum allowed number of miRNAs from miRNA set.
- Max Size: Maximum allowed number of miRNAs from miRNA set.
- Sample norm method: Choose from {'rank','log', 'log_rank'}.
- Weighted score type: Weighting by the correlation is a very reasonable choice that allows significant miRNA sets with less than prefect coherence.
- Submit the request by clicking "Submit" button.
Users can download the "Example Profile" and adjust the format of their own files.
The reference miRNA set annotations in sTAM are constituted by 151 miRNA-family sets(Family), 211 miRNA cluster sets(Cluster), 547 miRNA-disease sets(HMDD) and 155 miRNA-function sets(Function), 166 miRNA-TF sets(TF) and 6 tissue specificity sets(TissueSpecific). In addition, users could upload their miRNA sets as well.
(1) 'rank': Rank your expression data, and transform by 10000*rank_dat/miRNA_numbers.
(2) 'log': Do not rank,but transform data by log(data + exp(1)), while data = data[data < 1] = 1.
(3) 'log_rank': Rank your expression data, and transform by log(10000*rank_dat/miRNA_numbers + exp(1)).
Results of sTAM
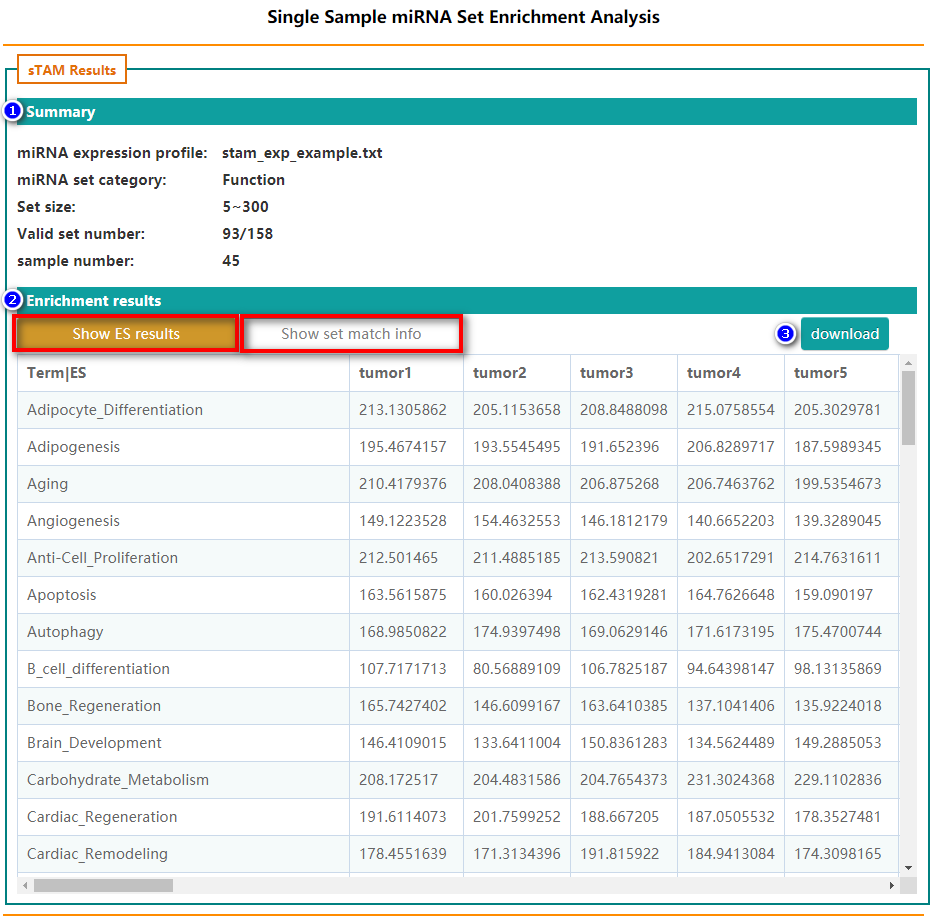
- Summary
- Enrichment results
Summary of the basic information
The result of sTAM, include two part: enrichment scores and matched miRNAs in corresponding set. Users can click "download" button to package and download the results.
miRNA set enrichment analysis
Please jump to "tpMSEA" tab page.
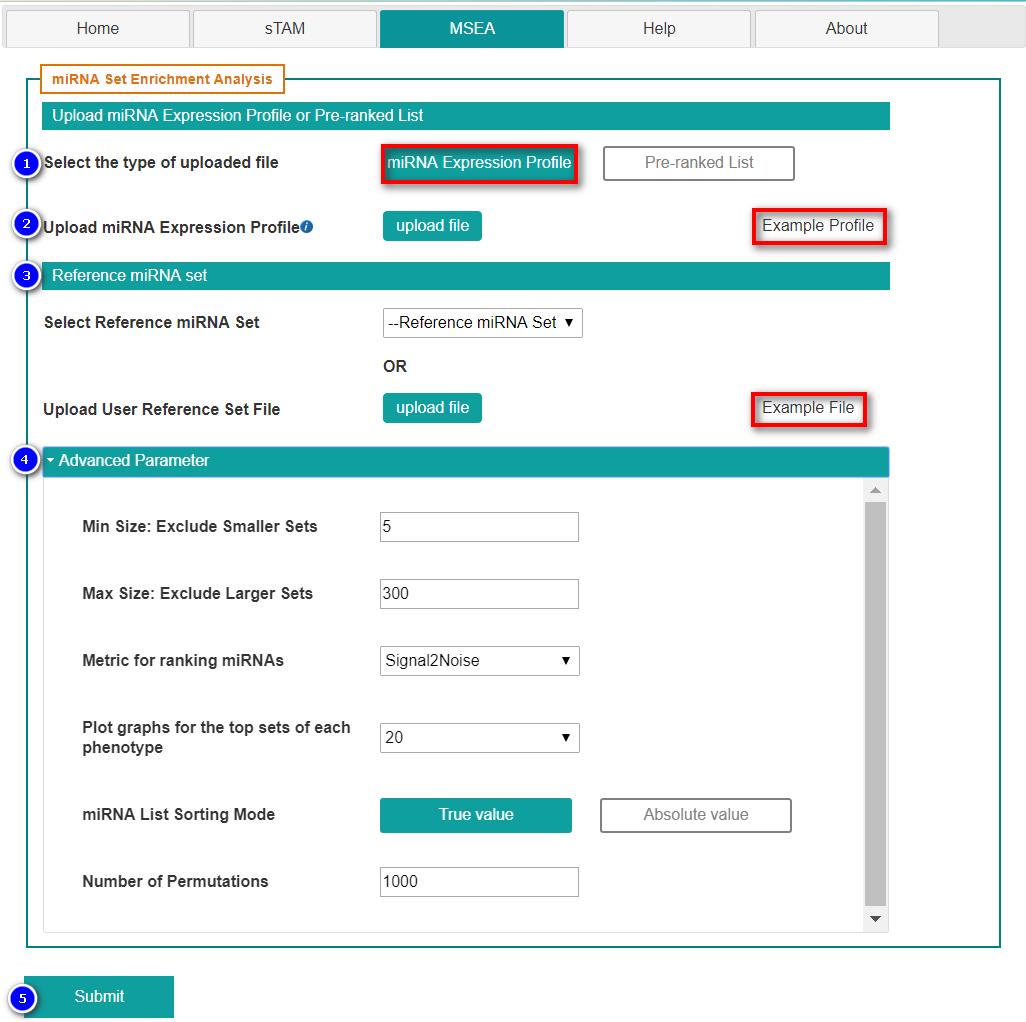
- Select "miRNA Expression Profile"
- Upload miRNA expression profile
- Select reference miRNA set
- Set advanced parameters
- Min size: Minimum allowed number of miRNAs from miRNA set.
- Max size: Maximum allowed number of miRNAs from miRNA set.
- Metric for ranking miRNAs:
- Plot graphs for the top sets of each phenotype: default 20.
- miRNA list sorting mode: True value(may include negative value) or Absolute value.
- Number of permutations: Specify the number of miRNA set permutations to perform in assessing the statistical significance of the enrichment score.
- Submit the request by clicking "Submit" button.
The header must contain two phenotypes in the uploaded profile. Users can download the "Example Profile" and adjust the format of their own files.
(1) 'Signal2Noise': Signal2Noise (default) uses the difference of means scaled by the standard deviation.
(2) 'tTest': tTest uses the difference of means scaled by the standard deviation and number of samples.
(3) 'Fold Change': Fold Change uses the ratio of class means to calculate fold change for natural scale data.
(4) 'Log2 Fold Change': Log2 Fold Change uses the log2 ratio of class means to calculate fold change for natural scale data.
(3) 'Diff_of_Classes': Diff_of_Classes uses the difference of class means to calculate fold change for log scale data.
Note that the higher the number, the longer the running time.
Results of MSEA
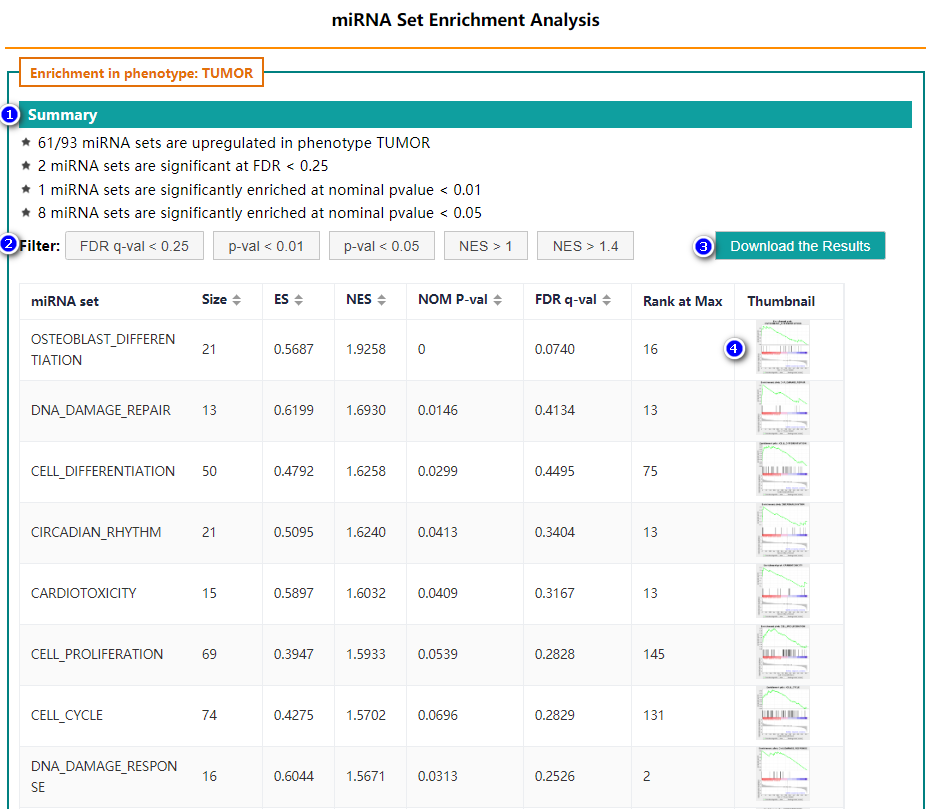
- Summary
- Filter
- Download results
- Detail information
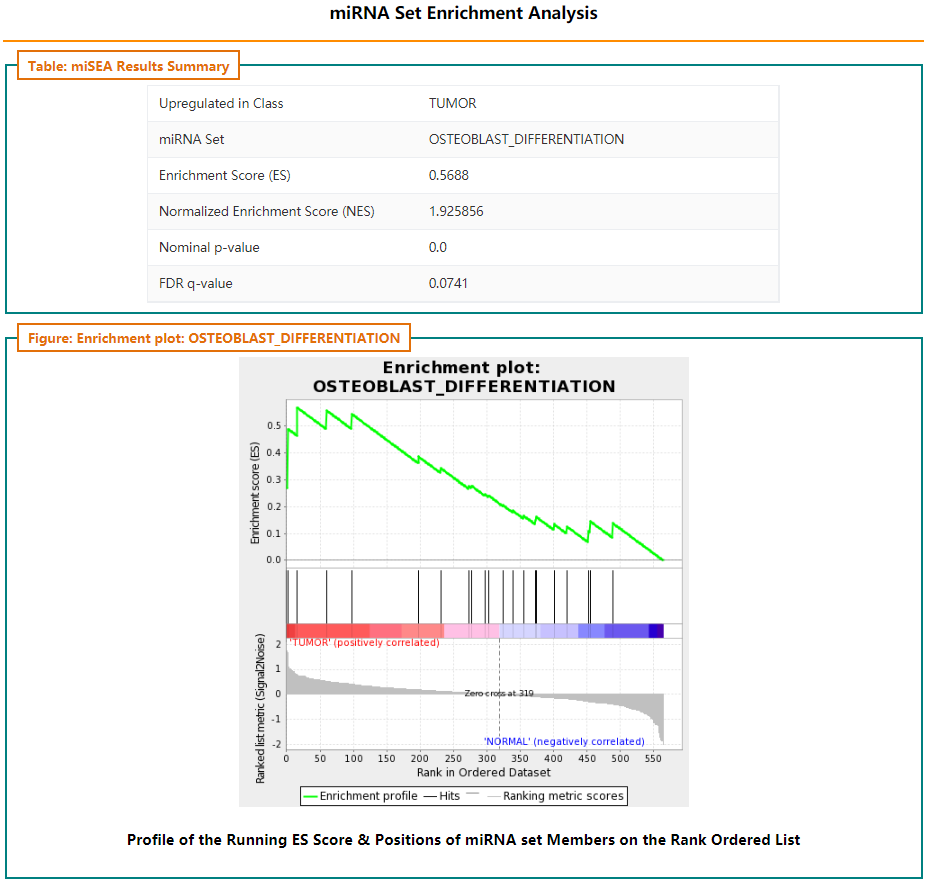
Summary of the basic information
Users can filter the results by clicking the buttons.
Users can click "download" button to package and download the results.
Users can click thumbnail to see detail information about corresponding miRNA set:
Pre-ranked miRNA set enrichment analysis
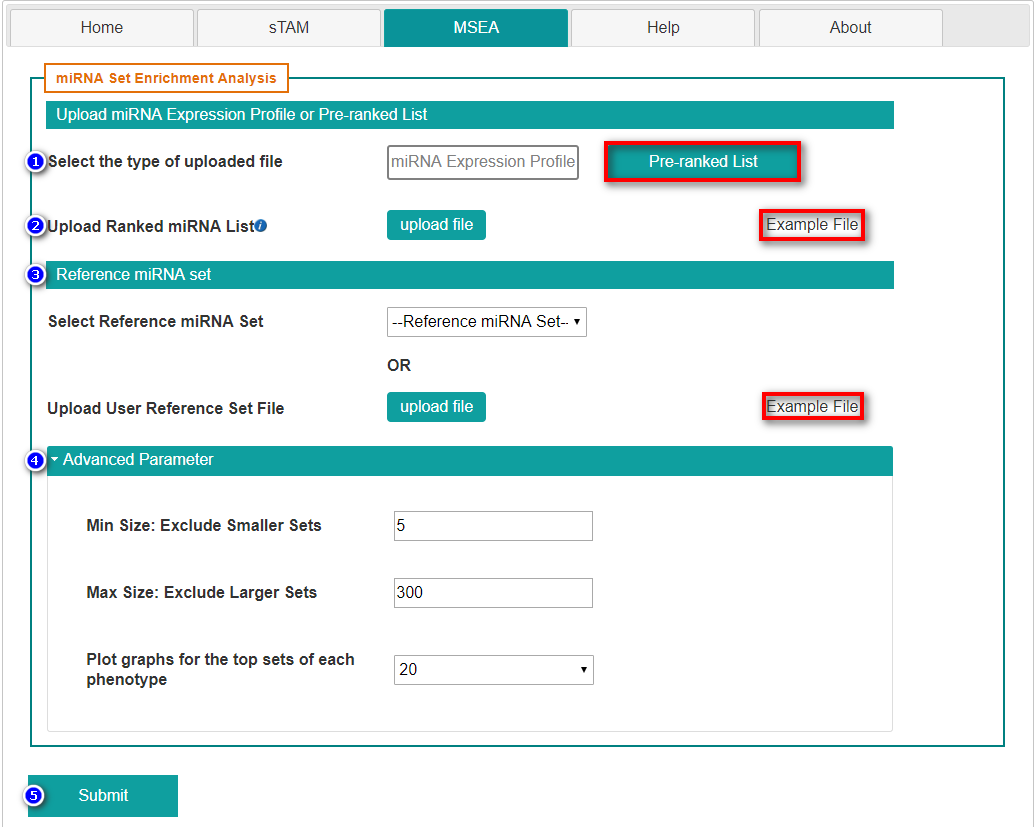
- Select "Pre-ranked List"
- Upload ranked miRNA list
- Select reference miRNA set
- Set advanced parameters
- Submit the request by clicking "Submit" button.
Two columns consist of miRNA list and weight. The weight can be FoldChange, log2(FoldChange), signal noise ratio and so on. Users can download the "Example File" and adjust the format of their own files.
Welcome to sTAM
Introduction
sTAM is a computational tool for single sample miRNA set enrichment analysis (MSEA). sTAM integrated the miRNA sets collected in TAM 2.0 (http://lirmed.com/tam2), a tool we previously developed for MSEA of miRNA lists in 2018. sTAM can calculate the enrichment score for one miRNA set in the miRNA expression of one single sample. In addition, sTAM also implemented profile-level MSEA. This is different with TAM 2.0 which runs for a miRNA list, whereas MSEA in sTAM runs for a miRNA profile dataset.
This website has been tested by using Chrome, Microsoft Edge and Firefox browsers. Microsoft IE may not work well.
Quick start:
-
For users who have miRNA expression profiles and wish to perform single sample miRNA set enrichment analysis, they would jump to ssMSEA tab page.
-
For users who have miRNA expression profiles for two classes of samples(e.g. tumor and control) and wish to perform miRNA set enrichment analysis, they would jump to tpMSEA tab page.
-
For users who have a pre-ranked miRNA list consist of miRNA names and weights, they would jump to tpMSEA(pre-ranked) tab page.
-
For more detail tutorial, please click here
- News
- Jan. 11, 2020: The help tutorial was enhanced. The known bugs were fixed.
- Dec. 10, 2019: MSEA method was implemented in sTAM.
- Nov. 17, 2019: sTAM was made available.
- Statistics
- Contact
sTAM results from collaboration between groups from Hebei University of Technology and Peking University Health Science Center. We try to understand life science using computing.
sTAM tool is free only for academic usage. For commercial useage, please contact:
Dr. Qinghua CuiDepartment of Biomedical Informatics, Department of Physiology and Pathophysiology, Center for Noncoding RNA Medicine, MOE Key Lab of Cardiovascular Sciences, School of Basic Medical Sciences, Peking University, Bejing, China
Email: cuiqinghua@hsc.pku.edu.cn